The housing trends report for the fourth quarter of 2018 was just released by the National Association of Home Builders.
Anyone buying or selling soon can learn a lot from this.
-The Housing Trends Report (HTR) measures prospective home buyers’ perceptions about the availability and affordability of homes for- sale in their markets.
-All data are derived from national polls of representative samples of American adults conducted for NAHB by Morning Consult. This report is released quarterly to track changes in buyers’ perceptions over time.
-The inability to find an affordable home is the reason more than 50% of Millennial and Gen X buyers looking for 3+ months haven’t pulled the trigger.
-Polls are based on a national sample of adults selected to proportionately represent the US adult population in terms of age, gender, region, race/ethnicity, and income.
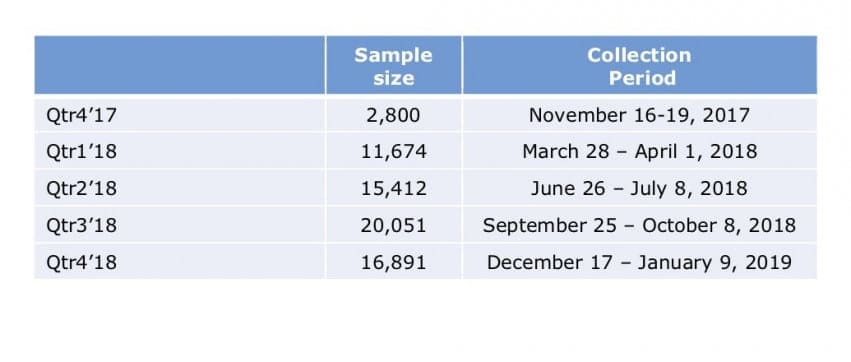
-Table shows sample size and dates of data collection.
-All data are derived from national polls of representative samples of American adults conducted for NAHB by Morning Consult. This report is released quarterly to track changes in buyers’ perceptions over time.
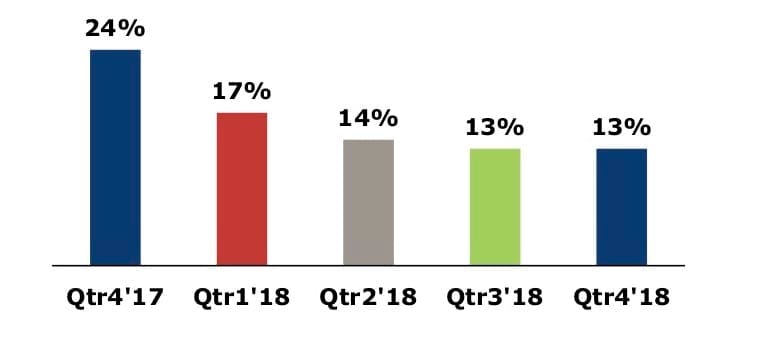
Planning to buy a home within 12 months
13% of respondents in Qtr4’18 are prospective home buyers, i.e. they are planning to buy a home within 12 months. A year earlier, that share stood at 24%.
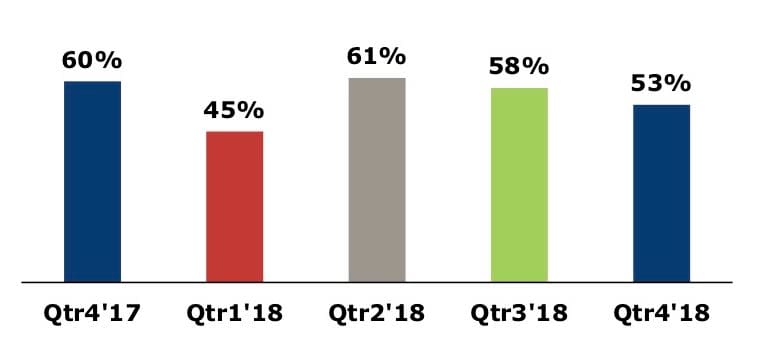
1st-Time Home Buyers
Most prospective home buyers in Qtr4’18 are first-time buyers (53%). A year earlier, 60% of those planning a home purchase were first-timers.
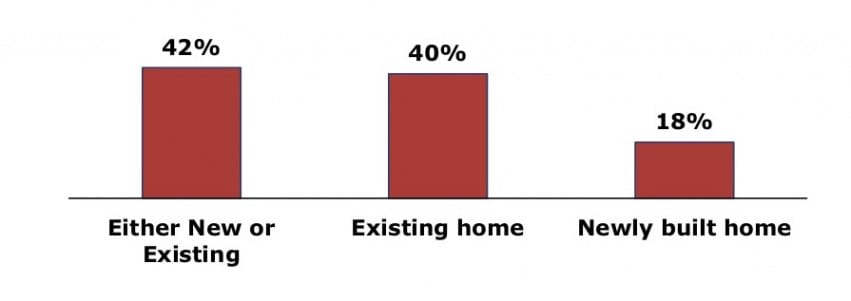
New Or Existing Home?
42% of buyers in Qtr4’18 would buy either a new or existing home; 18% are looking only at newly built homes.
Over 40% of buyers in each generation would buy either a new or existing home.
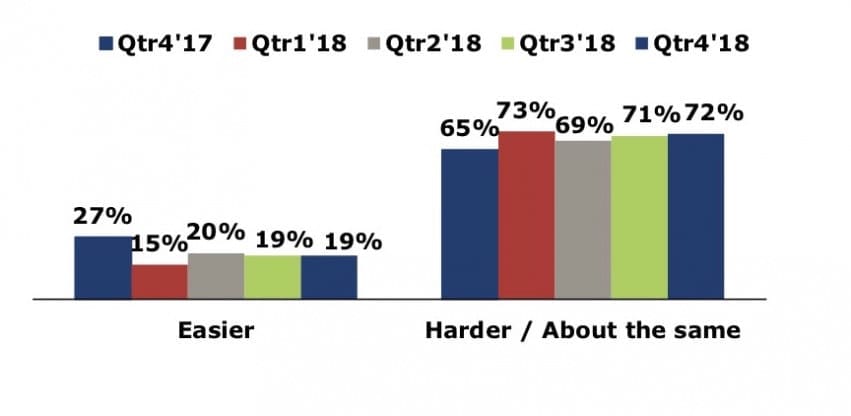
Availability Expectations
-19% of buyers in Qtr4’18 expect their house search to get easier in the months ahead; in comparison, 27% had that same expectation a year earlier.
-72% think the search will get harder or stay about the same (up from 65% a year earlier).
-Across generations, only a minority of buyers expect house search to get easier: Millennials (21%), Gen X (21%), and Boomers (15%).
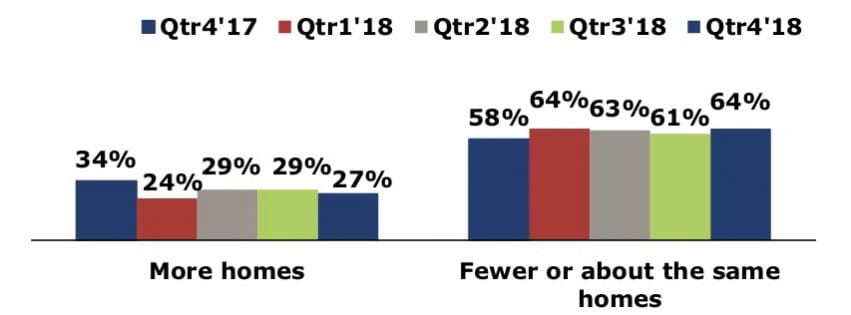
Changes In Inventory
-27% of buyers in Qtr4’18 report seeing more homes for-sale* than three months earlier, a smaller share than a year earlier (34%).
-Instead, a majority of 64% report seeing fewer/same number of homes for- sale*, up from 58% a year earlier.
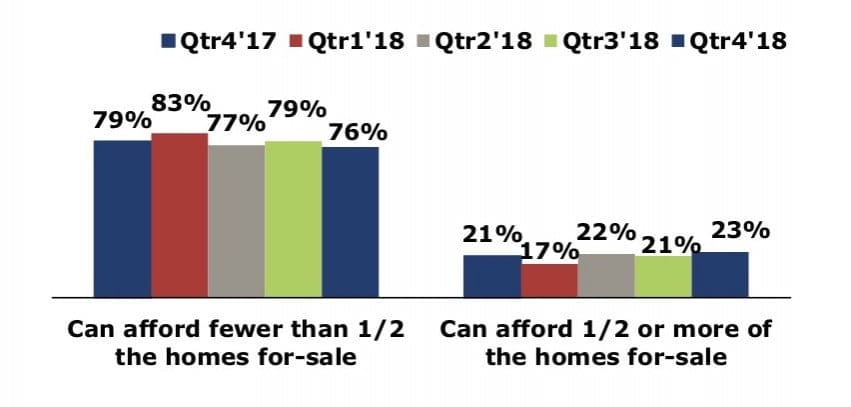
Affordability Expectations
-Three out of four buyers (76%) in Qtr4’18 can afford fewer than half the homes available in their markets. A year earlier, that share stood at 79%.
-A minority of 23% can afford the majority of homes available, barely ahead of the 21% share a year earlier.
-Affordability is an issue for all age groups: 75% to 78% of buyers in each generation can afford fewer than half the homes available in their markets.
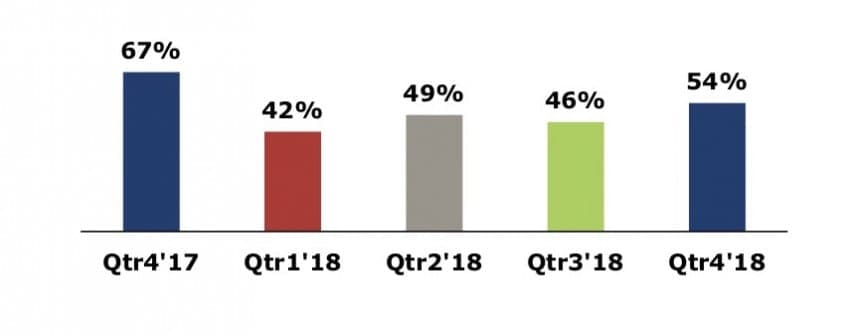
Beyond Just Planning
-54% of prospective buyers in Qtr4’18 are already actively trying to find a home to buy (and not just merely planning it). That share is down from 67% a year earlier.
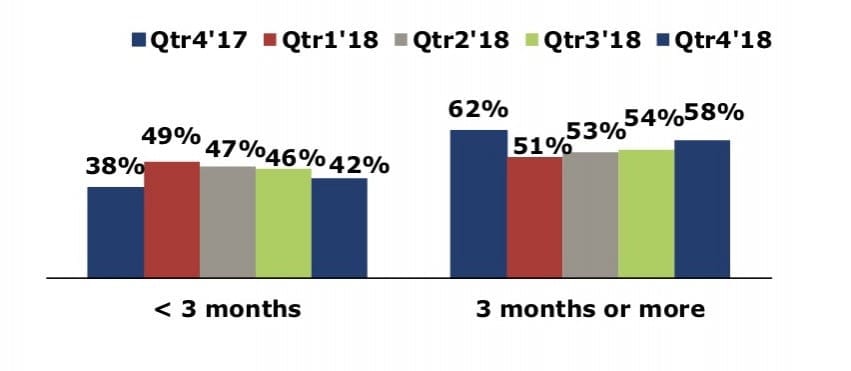
Time Spent Searching For A Home
-In Qtr4’18, 58% of those already actively looking for a home to buy have been searching for 3+ months – a slight decrease from the 62% share a year earlier.
-Nearly 60% of each generation’s active buyers have been looking for 3+ months for the right home to buy.
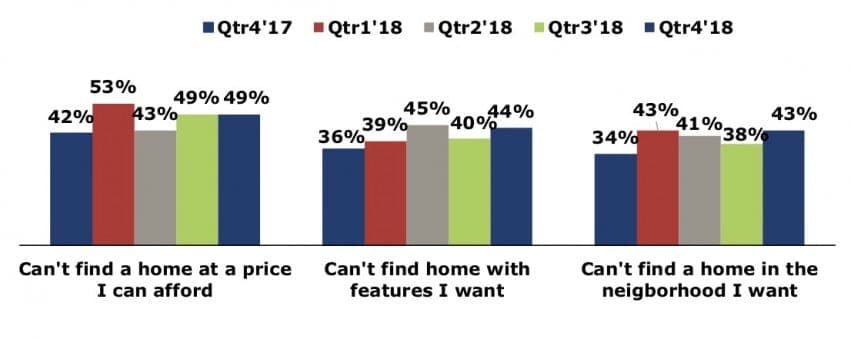
Top Reasons Buyers Active For 3+ Months Have Not Been Successful
-In Qtr4’18, the top two reasons long-time searchers didn’t pull the trigger were inability to find an affordable home (49%) and inability to find a home with desired features (44%). Both barriers are more significant than a year earlier, when they stood at 42% and 36%, respectively.
-The inability to find an affordable home is the reason more than 50% of Millennial and Gen X buyers looking for 3+ months haven’t pulled the trigger.
Poll Design
-The Housing Trends Report is based on quarterly polls conducted for NAHB by the research firm Morning Consult.
-Polls are based on a national sample of adults selected to proportionately represent the US adult population in terms of age, gender, region, race/ethnicity, and income.
-Table shows sample size and dates of data collection.